What if the safety report you spent hours preparing is actually increasing the personal liability anxiety of your directors instead of providing the reassurance they need? It’s a common frustration amongst safety professionals; you’ve gathered the data and tracked the trends, yet you’re met with glazed expressions or questions about business ROI that seem disconnected from daily operations. You likely recognise that whilst your board members care deeply about staff welfare, they often struggle to bridge the gap between technical jargon and strategic governance.
By mastering the art of presenting safety statistics to the board, you can transform these high-stakes meetings from a compliance hurdle into a powerful demonstration of due diligence. At DL Safety, we believe that transparency and honesty are the foundations of a strong safety culture, and this guide provides you with a repeatable 2026 reporting framework designed to turn raw data into actionable insight. We will explore how to move beyond simply counting accidents to measuring organisational resilience, ensuring your reporting is thorough, methodical, and easy to digest. This structured approach helps you lead the conversation from a state of uncertainty to one of absolute confidence.
Key Takeaways
- Discover why boardroom reporting is shifting in 2026 from reactive “accident counting” towards a proactive focus on organisational resilience and strategic risk management.
- Learn how to balance lagging indicators with essential leading metrics, such as site audits and GA1 testing results, to provide a comprehensive view of safety performance.
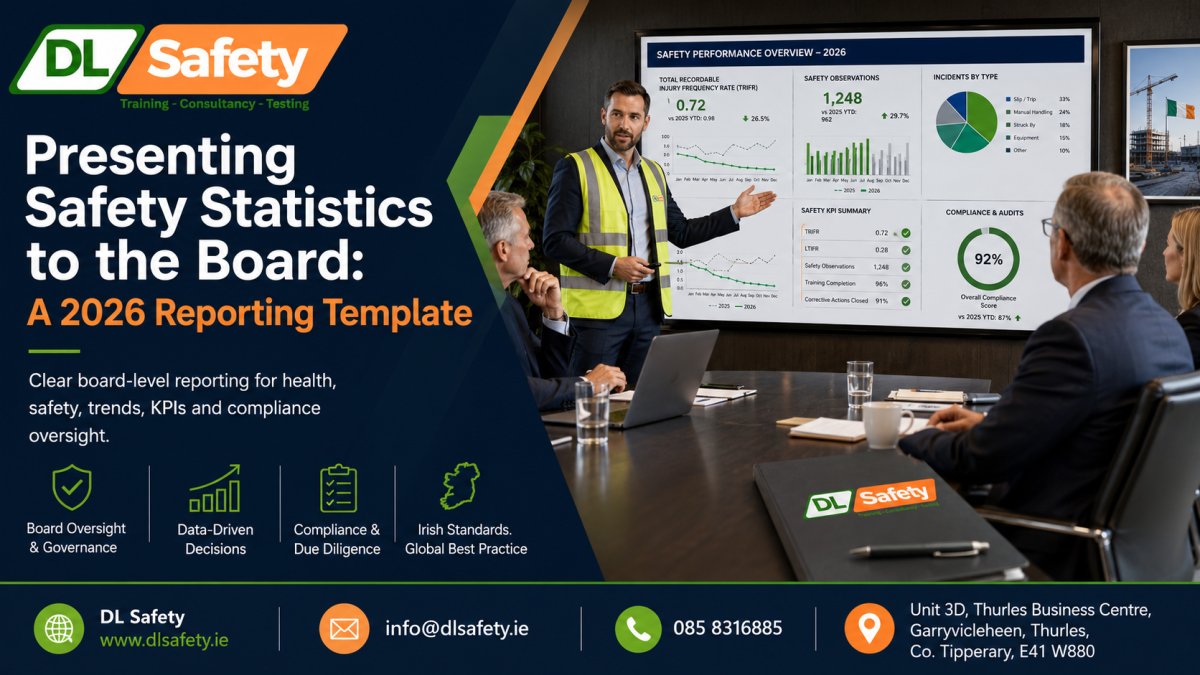
- Master the art of presenting safety statistics to the board using a modular template that features a high-level executive summary and a visual KPI dashboard.
- Utilise high-impact visualisation tools like the “Traffic Light” system and 12-month trend lines to ensure directors can quickly grasp complex data without getting lost in technical jargon.
- Understand how professional third-party support can provide the objective data and “fresh eyes” necessary to demonstrate genuine due diligence and protect directors from liability.
Why Boardroom Safety Reporting is Shifting in 2026
The role of the board has evolved significantly. It’s no longer sufficient to simply report that no one was injured last month; in 2026, the focus has pivoted towards measuring organisational resilience. This means your approach to presenting safety statistics to the board must move beyond reactive accident counting. Instead, it should illustrate how your Safety Management System actively identifies and mitigates risks before they manifest as incidents. This strategic shift ensures that safety is viewed as a pillar of business sustainability and reputation, rather than a mere box-ticking exercise. A well-structured report serves as a roadmap for future investment, helping the board see safety as a value-add that links performance to operational efficiency.
A comprehensive boardroom report protects the business in several ways:
- Demonstrates legal due diligence during HSA audits.
- Upholds corporate reputation amongst stakeholders and clients.
- Identifies financial risks before they escalate into costly claims.
- Fosters a culture of transparency from the site to the C-suite.
Due Diligence and Director Responsibilities
Directors hold significant personal responsibility for employee welfare under Irish law. When the Health and Safety Authority (HSA) conducts an inspection, they scrutinise governance as much as physical site conditions. A robust safety report serves as vital evidence of “due diligence,” proving that the board is informed and taking proactive steps to manage risk. For a deeper look at these legal obligations, you can read our guide on Director’s Responsibilities for Health and Safety in Ireland. Providing clear, honest data protects leadership from personal liability whilst fostering genuine accountability across the organisation.
Bridging the Gap Between Site and Board
Technical jargon often creates a barrier between safety professionals and the board. Directors don’t need to know the serial number of a failed lifting chain; they need to know if the inspection regime is effective. When presenting safety statistics to the board, focus on the “Big Picture” findings and translate technical data into business impact. If site audits show declining compliance, explain the risk and your proposed solution clearly. Transparency is essential; being honest about challenges builds far more trust than presenting a perfect, yet unrealistic, record.
This transparency and commitment to safety should permeate every level of corporate activity, from the construction site to executive transport. For companies managing global operations, it is worth looking for partners that mirror these high standards; you can discover White Line Limousine LLC for professional and secure chauffeur services in Dubai.
DL Safety, based at Unit 3D Thurles Business Center, Stradavoher, Thurles, County Tipperary, E41 W880, provides the expertise needed to bridge this gap. Our team is available at info@dlsafety.ie or on 085 8316885 to help you refine your reporting strategy. You can also visit our website at www.dlsafety.ie for more resources and professional support.
Lagging vs Leading Indicators: What to Track
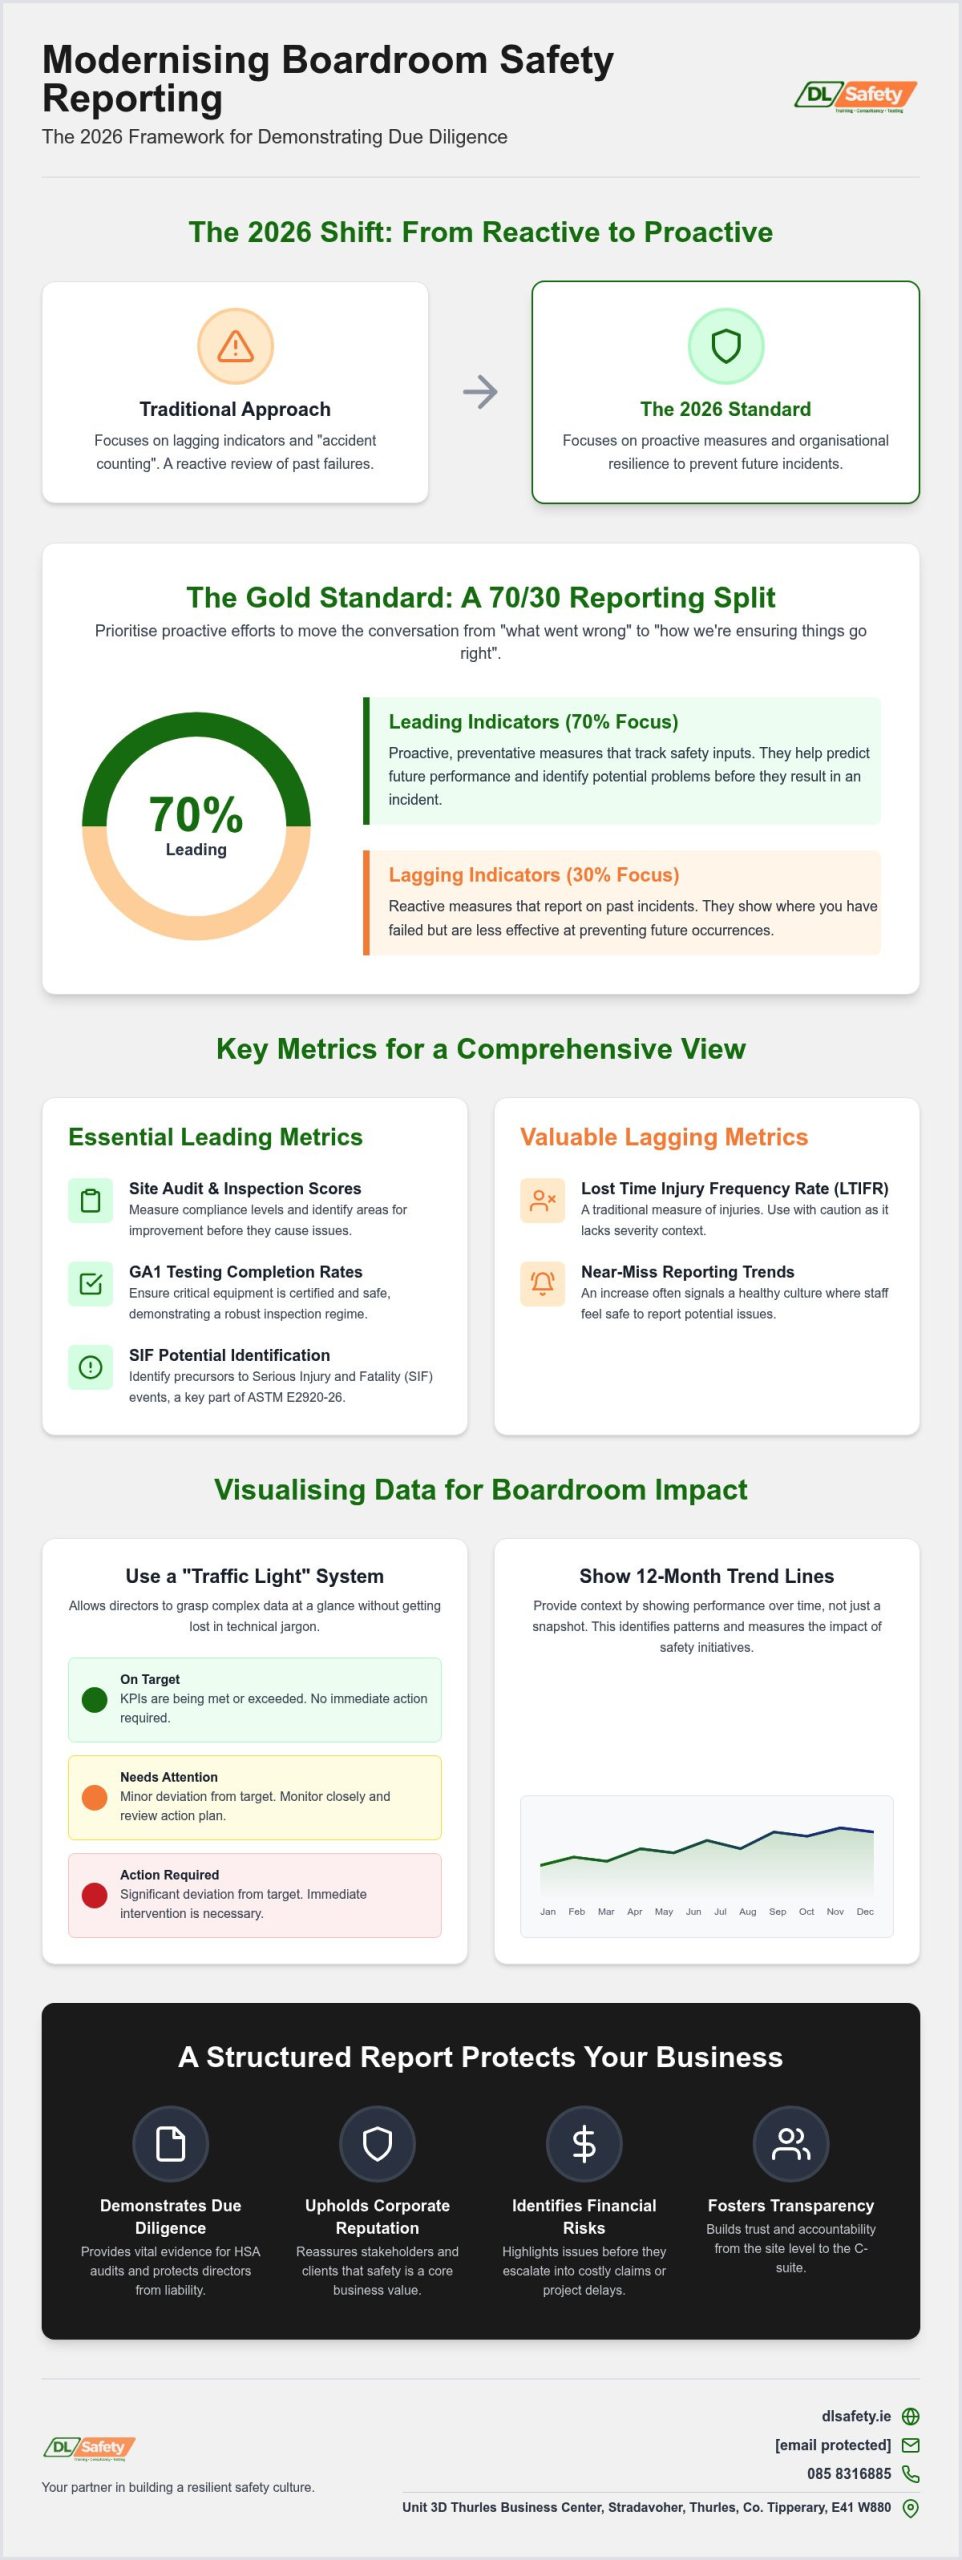
Effective boardroom reporting requires a strategic balance between looking at the rearview mirror and scanning the road ahead. In 2026, the industry gold standard has shifted towards a 70/30 split. This means that 70% of your time spent presenting safety statistics to the board should focus on leading indicators. The recently updated ASTM E2920-26 standard reinforces this shift by prioritising the identification of Serious Injury and Fatality (SIF) potential before an incident occurs. By focusing on proactive efforts, you move the conversation from “what went wrong” to “how we’re ensuring things go right.”
Choosing the right KPIs is not a one-size-fits-all task. Your metrics should align with your specific industrial or construction risks, such as transportation incidents, which remained the most frequent cause of fatal workplace injuries in 2024. Our Monthly Safety Support Packages are designed to help you identify these specific risks and automate the data collection process, ensuring your reports are both accurate and relevant.
Essential Lagging Metrics
Lagging indicators measure outcomes that have already happened. Whilst the Lost Time Injury Frequency Rate (LTIFR) is a staple, it has limitations because it doesn’t account for the severity of potential risks. Near-miss reporting is often a more valuable lagging metric; an increase in these reports usually signals a healthy, transparent reporting culture rather than a decline in safety. Translating these incidents into financial impact is also vital for the board. For instance, with 2026 OSHA penalties for serious violations reaching $16,550 per instance, the cost of inaction is clear. These figures are essential components of a thorough OSHA Program Evaluation and Improvement strategy.
High-Impact Leading Metrics
Leading indicators are the proactive measures that predict future performance. A critical metric for any construction or lifting operation is the percentage of completed GA1 testing and equipment inspections. If your equipment isn’t certified, your risk profile increases instantly. Other high-impact metrics include safety audit scores and the speed at which corrective actions are closed. Tracking training competency levels across the workforce is also essential; it ensures that your team isn’t just “trained” but truly competent in high-risk tasks. These metrics provide the board with a clear demonstration of due diligence and active risk management.
Visualising Safety Data for Maximum Impact
Data is only as powerful as its ability to be understood. When you’re presenting safety statistics to the board, your primary goal is to strip away the noise and highlight the signal. A “Traffic Light” system, using Red, Amber, and Green (RAG) status, is incredibly effective for this purpose. It provides an immediate, high-level overview of risk areas that require urgent attention without requiring the board to dive into spreadsheets. By pairing these indicators with 12-month rolling trend lines, you can show whether safety performance is genuinely improving or if recent successes are merely statistical outliers. This long-term view is essential for strategic planning.
It’s vital to be wary of “Zero Harm” dashboards. Whilst they look impressive on a slide, they can inadvertently encourage a culture where minor incidents or near misses go unreported to keep the “zero” intact. This creates a dangerous blind spot for leadership. Instead, focus on transparency and honesty. Benchmarking your data against national industry standards provides the board with necessary context. For example, knowing that falls remain the leading cause of death in construction, responsible for 33% of fatalities in 2024, helps justify investment in working-at-height training. This objective comparison is a core part of OSHA’s framework for safety program evaluation, ensuring your internal metrics align with broader regulatory expectations.
Data Storytelling for Executives
Directors don’t just want to see a graph; they want to understand the “so what” behind the numbers. If your audit scores have dropped, explain the systemic cause. You might use findings from previous accident investigations to illustrate how a specific trend, like poor vehicle maintenance, could lead to a serious incident. Highlighting successes is equally important. When a new initiative leads to an increase in proactive reporting, celebrate it as a sign of an improving safety culture. This narrative approach turns raw data into a compelling business case for safety.
Avoiding “Chart Junk”
The most common mistake in boardroom reporting is over-complicating visuals with irrelevant technical data. Keep your slides clean. Each visual should focus on one key message. If a chart requires a five-minute explanation, it’s too complex. Ensure your visuals are accessible to all board members, regardless of their safety background. By removing “chart junk” and sticking to plain English, you build a narrative of trust and clarity. If you need help refining your data presentation, contact DL Safety at info@dlsafety.ie or visit www.dlsafety.ie for professional support.
The Modular Monthly Safety Report Template
To bridge the gap between site operations and the C-suite, you need a structured framework that remains consistent month after month. A modular template ensures that when you are presenting safety statistics to the board, the directors know exactly where to look for the information they need most. This consistency builds trust and allows for easier comparison over time, turning a static report into a dynamic tool for improvement. By following a set structure, you ensure no critical area of risk is overlooked, whilst providing the board with the high-level overview they require for effective governance.
A high-impact monthly report should be divided into five distinct sections:
- Section 1: Executive Summary. This is the 30-second overview for the CEO. It should summarise the overall RAG status and any critical issues that require immediate attention.
- Section 2: KPI Dashboard. A visual representation of the 70/30 leading and lagging indicator split we discussed earlier. This provides the data-driven heart of the report.
- Section 3: Incident Analysis. Rather than just listing accidents, this section focuses on root causes and lessons learned. It demonstrates that the organisation is learning from its mistakes.
- Section 4: Compliance Status. This includes updates on subcontractor compliance, GA1 testing, and other statutory requirements like PAT testing or brake testing for quarry vehicles.
- Section 5: Resource Requests. This is where you link your data to the need for budget or personnel. If the data shows a spike in manual handling injuries, this is the place to request investment in bespoke training.
How to Customise the Template
Every industry has unique challenges, so your template must be adaptable. For high-risk sectors like quarrying or heavy lifting, you might include specific metrics for excavator lifting training or on-site brake testing results. It’s essential to set realistic thresholds for your “Amber” and “Red” alerts; if every minor issue triggers a red alert, the board will quickly suffer from alarm fatigue. Integrating feedback from site-level toolbox talks into the report can also provide a human element that raw statistics often lack.
Frequency and Distribution
For high-risk industries, monthly reporting is the absolute minimum requirement to maintain due diligence. The report should flow logically from past performance to future goals, ensuring the board sees the big picture. Timing is everything. Ensure the report is distributed whilst the data is still relevant, ideally within five working days of the month’s end. Our team at DL Safety can help you implement this framework through our Monthly Safety Support Packages, ensuring your data is always boardroom-ready.
For professional guidance on presenting safety statistics to the board, contact us at info@dlsafety.ie or call 085 8316885. You can also visit us at Unit 3D Thurles Business Center, Stradavoher, Thurles, County Tipperary, E41 W880, or browse our resources at www.dlsafety.ie.
Elevating Safety Culture through Professional Support
Internal teams often face immense pressure to present “clean” data, which can lead to unintentional bias or a tendency to downplay recurring issues. Outsourcing your data collection ensures that you’re presenting safety statistics to the board that are grounded in absolute honesty and objectivity. A “Third-Party Eye” identifies subtle risks that internal managers might overlook simply through familiarity with the site. This external perspective doesn’t just improve the quality of your reporting; it significantly reduces the administrative burden on your health and safety managers, allowing them to focus on active risk mitigation rather than spreadsheet management.
Our Monthly Support Packages at DL Safety provide the structural backbone for these boardroom reports. We don’t just provide raw numbers; we deliver the strategic insight required to turn those numbers into better business decisions. By having a dedicated professional manage the collection and analysis of your safety data, you ensure that the information reaching the C-suite is consistent, thorough, and ready for scrutiny. This creates a culture where safety is treated with the same financial and strategic rigour as any other department, whilst building a narrative of trust between the site and the directors.
Integrating Professional Audits into Your Report
External audit scores are amongst the most credible leading indicators you can include in your reporting template. They provide an unbiased benchmark of your current performance against industry standards, which is far more persuasive to a board than internal self-assessments. When paired with professional GA1 testing results and specialised reports from UK Fire Risk Assessments, your compliance data becomes bulletproof. This level of detail proves to the board that your equipment and systems are functioning as intended. If you need assistance building a bespoke reporting framework that reflects your specific operational risks, DL Safety is here to support you.
Next Steps for Your Board
To truly drive a “Top-Down” safety culture, consider inviting a safety consultant to present high-level findings directly to your board once a quarter. This allows directors to ask technical questions in a plain-English environment and reinforces the importance of safety at the highest level of governance. Using safety statistics as a strategic lever helps shift the boardroom focus from “avoiding accidents” to “building a resilient business.” Moving forward with a structured approach to presenting safety statistics to the board will protect your people, your directors, and your corporate reputation.
For a confidential discussion about your reporting needs, contact us at info@dlsafety.ie or call 085 8316885. You can also visit our team at Unit 3D Thurles Business Center, Stradavoher, Thurles, County Tipperary, E41 W880, or explore our full range of services at www.dlsafety.ie.
Transforming Data into Strategic Governance
Mastering the art of presenting safety statistics to the board is about more than just listing numbers; it’s about building a culture of transparency and trust. By shifting your focus toward leading indicators and utilising a modular reporting framework, you provide directors with the clarity they need to fulfil their legal obligations whilst driving business performance. This structured approach ensures that safety is recognised as a vital pillar of your organisation’s long-term sustainability rather than a mere compliance hurdle.
At DL Safety, we help you secure this foundation through professional GA1 and PAT testing services alongside comprehensive site audits. Our team at Unit 3D Thurles Business Center, Stradavoher, Thurles, County Tipperary, E41 W880, is dedicated to turning your raw data into boardroom-ready insights. Whether you need help with root cause analysis or managing subcontractor compliance, we’re your proactive partners in safety excellence. You don’t have to manage the burden of complex reporting alone.
Download our Monthly Safety Support Guide to start refining your reporting process today. For bespoke support, reach out via info@dlsafety.ie or call us on 085 8316885. You have the tools and the framework to lead your organisation toward a safer, more resilient future.
Frequently Asked Questions
What are the most important safety KPIs for a construction board?
The most critical safety KPIs for a construction board include a balanced mix of leading and lagging indicators. You should focus on proactive metrics such as the percentage of completed GA1 testing and safety audit scores. These provide a forward-looking view of risk. Lagging indicators like the Lost Time Injury Frequency Rate (LTIFR) are also necessary to track historical performance. This combination ensures the board sees both current compliance and long-term trends.
How often should health and safety statistics be presented to the board?
Monthly reporting is the minimum recommended frequency for high-risk industries like construction and quarrying. This regular cadence ensures that safety remains a standing item on the agenda and that data stays relevant. It allows the board to identify emerging hazards quickly and allocate resources before minor issues escalate. Whilst quarterly summaries are useful for strategic planning, monthly updates are essential for maintaining active due diligence.
Is a high number of near-miss reports a bad sign for the board?
No, a high volume of near-miss reports is typically a positive indicator of a transparent safety culture. It suggests that your workforce is engaged and feels comfortable reporting hazards without the fear of being blamed. This transparency provides the board with a wealth of data to prevent serious injuries before they happen. Conversely, a total lack of reports is often a red flag that incidents are being suppressed or ignored.
How can I link safety statistics to the company’s financial performance?
Linking safety to financial performance involves translating incident data into operational costs and potential liabilities. You can highlight the impact of OSHA penalties, which can reach $165,514 for willful violations as of 2026. Beyond fines, consider the cost of insurance hikes, equipment repairs, and project delays. Proactive safety measures, like regular PAT testing, protect the bottom line by preventing these expensive disruptions and protecting the company’s reputation.
What is the difference between lagging and leading indicators in safety reporting?
Lagging indicators are reactive measures that track events that have already occurred, such as the number of workplace injuries. Leading indicators are proactive measures that track the activities intended to prevent those injuries, such as training hours or site audits. A high-quality report focuses on leading indicators to predict future performance. This shift allows the board to move from simply counting accidents to actively managing organisational resilience.
Should the board be involved in accident investigation findings?
Yes, the board should be informed of the high-level findings and root causes of serious accident investigations. This oversight ensures that leadership understands the systemic risks facing the business and can approve necessary corrective actions. Whilst the board shouldn’t manage the investigation process, their review of the findings is a critical component of their legal responsibility. It demonstrates that they are taking active steps to prevent a recurrence.
How do I present safety data to board members who are not safety experts?
When presenting safety statistics to the board, you should use plain English and clear visualisations like the RAG system. Avoid technical jargon that might confuse non-experts and focus on the strategic implications of the data. Explain what the numbers mean for the business’s risk profile and reputation. Providing a brief executive summary that highlights the ‘so what’ behind the statistics ensures that every director can engage with the report.
What legal protection does a board report provide to company directors?
A detailed board report provides vital legal protection by serving as documented evidence of a director’s due diligence. Under Irish law, directors must show they are informed about safety risks and are taking proactive steps to manage them. Regularly presenting safety statistics to the board creates a paper trail that can be used to defend the organisation during HSA inspections. For professional support with your reports, contact DL Safety at Unit 3D Thurles Business Center, Stradavoher, Thurles, County Tipperary, E41 W880, call 085 8316885, or visit www.dlsafety.ie.